
Empowering the people who care about our ecosystems
Sensing and analytics for forest management and conservation
We develop technology to support uneven-aged, continuous cover forest management and conservation, and provide scientists with cutting-edge digital tooling. We do it because we believe in empowering those on the frontlines of ecosystem conservation and environmental protection.
Our partners


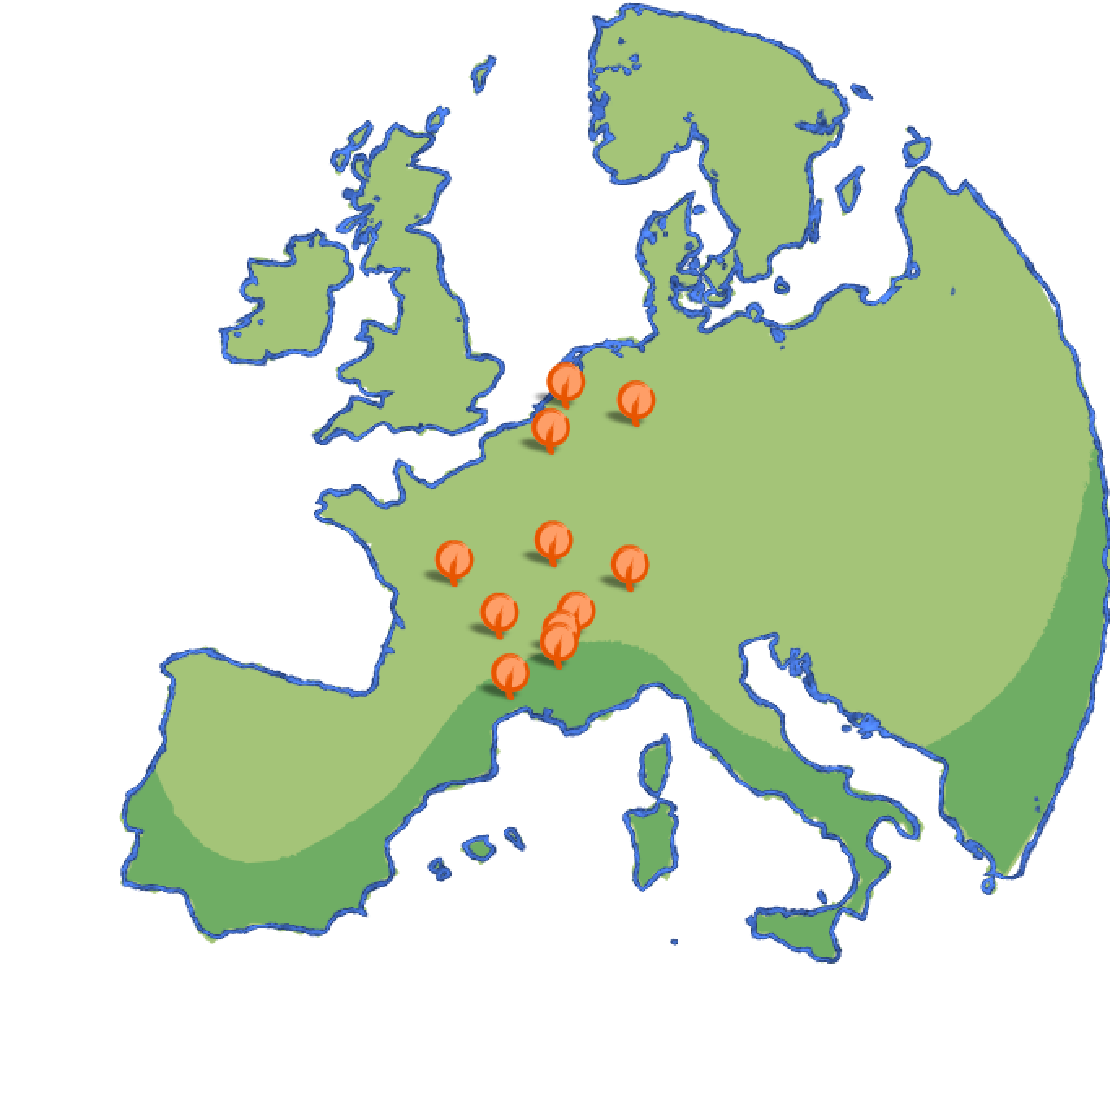
Our monitoring deployments in Europe
Projects map
Together with our partners and clients, we deployed more than 1000 ecosystem monitoring devices in 5 countries, supporting scientific and conservation projects with realtime ecosystem data.
Are you a funder or working with one? Help us to open-source.
See our Pledge For Openness.A wide range of sensing dimensions
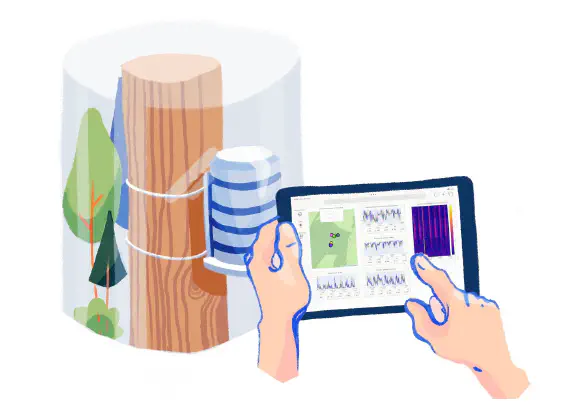
Tailored device configuration
In our experience, each project is unique and comes with its own distinct challenges. That’s why we designed our core hardware platform to be configurable and extensible, allowing us to compose tailored configurations depending on the project’s needs. A wide range of sensing dimensions, coupled with advanced on-board data processing capabilities, support a comprehensive understanding of the complex interactions within the ecosystem.
Sensors configuration
Peripherals configuration
Software configuration
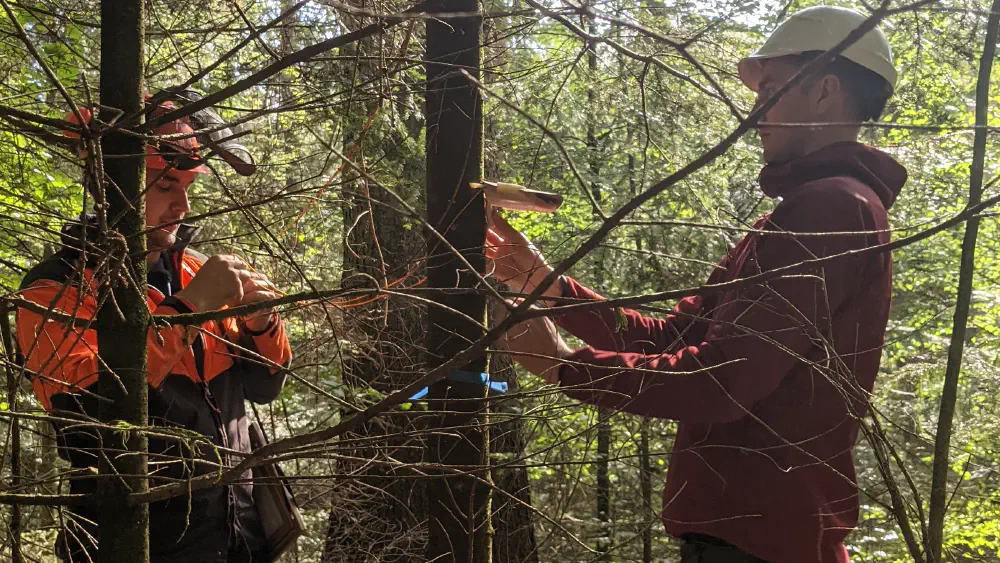
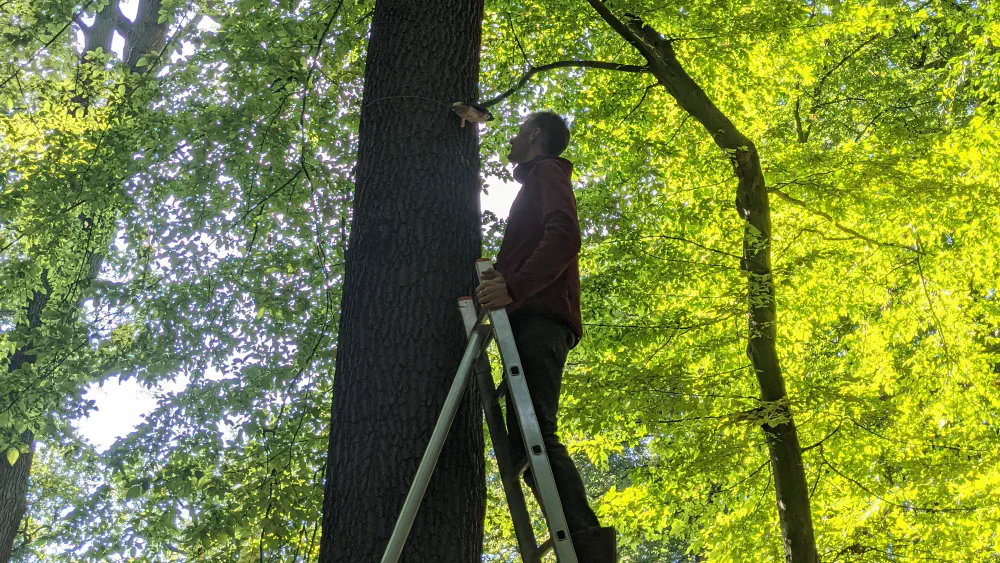
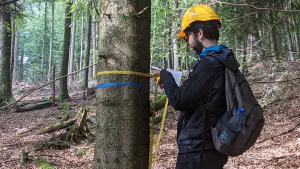
Our team in action
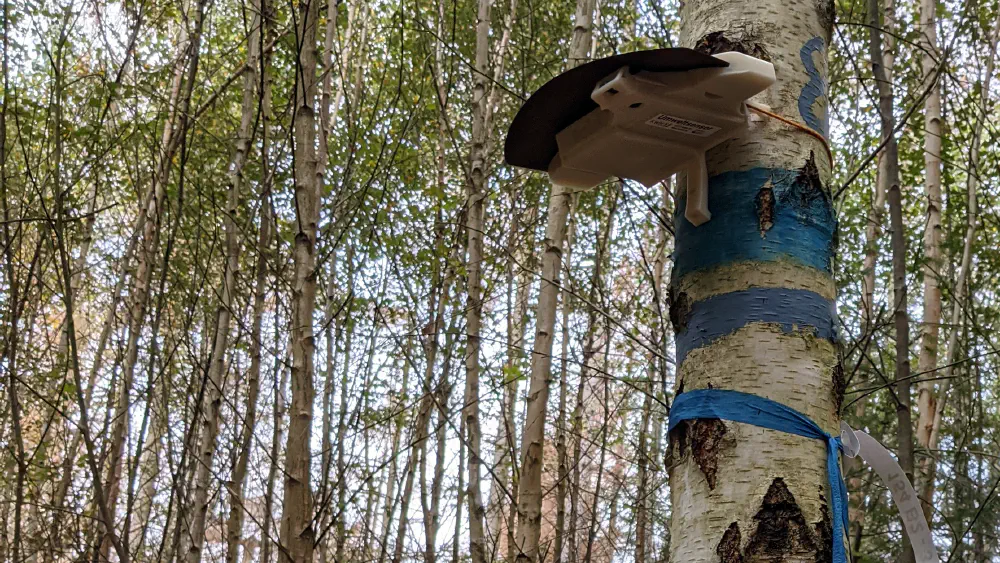
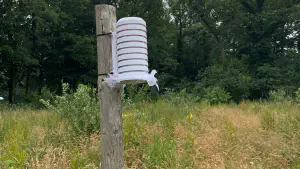
Deployed in nature

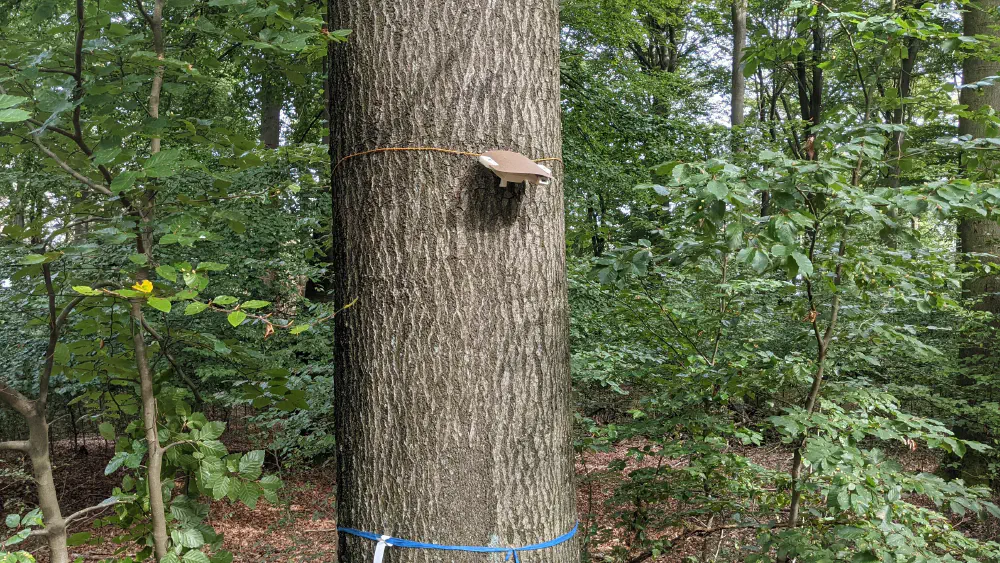

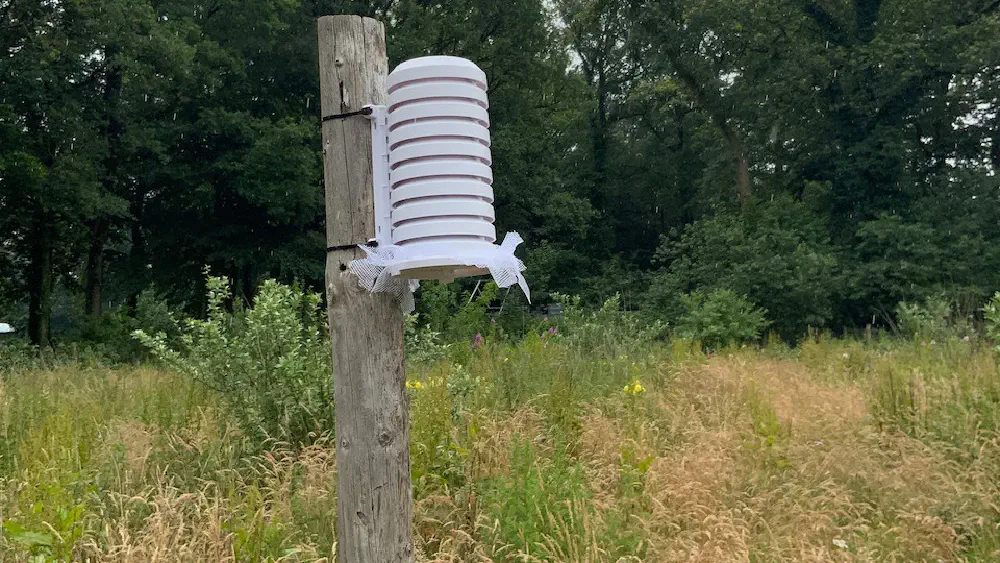
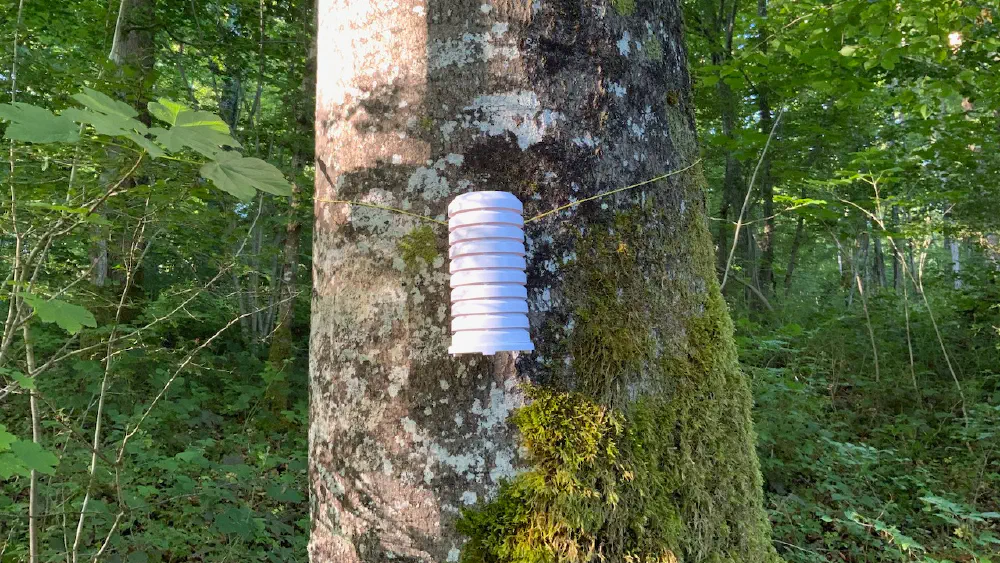
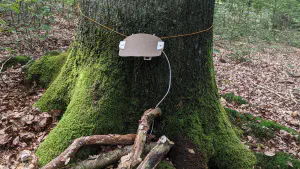
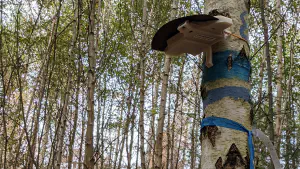
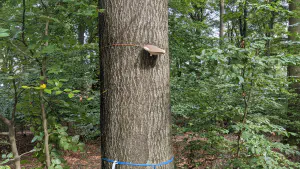


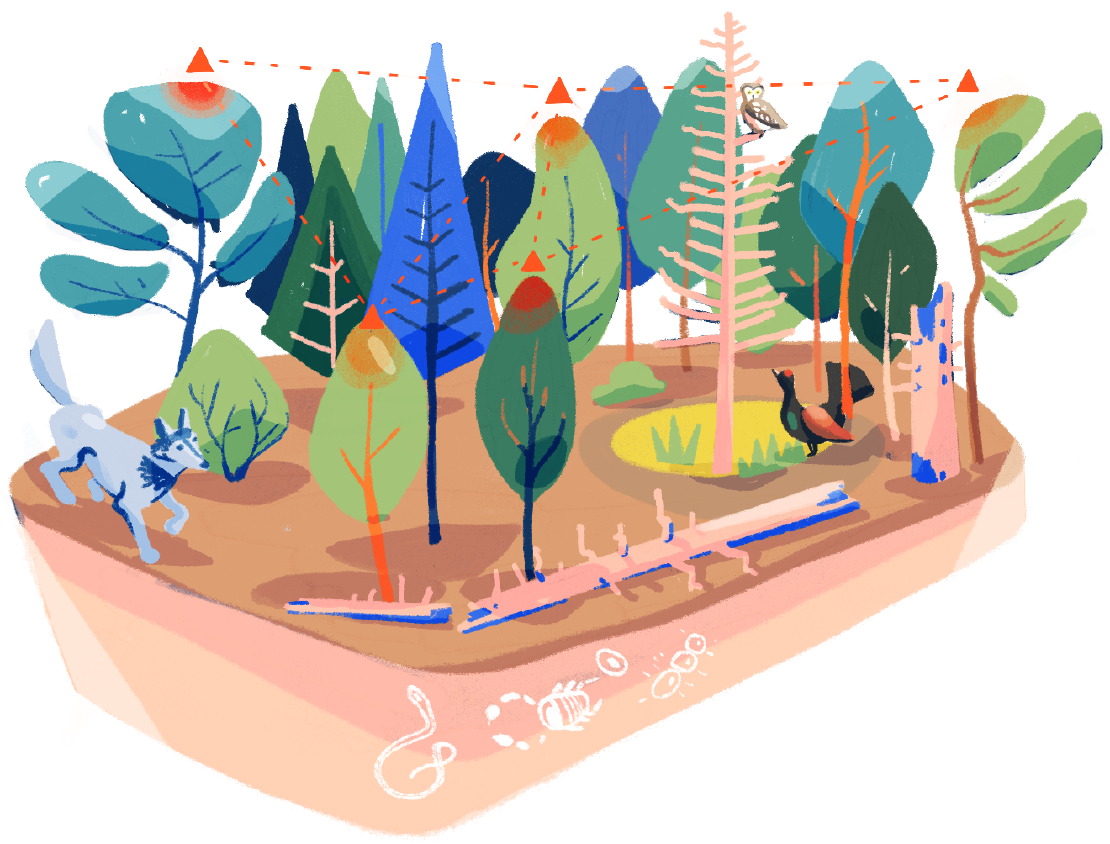
Adapting to nature's complexity
How we work with you
1
Define
Every ecosystem is different and no two projects are the same. As a first step, we explore with you what’s worth measuring and how, creating a data acquisition protocol and sampling strategy.
2
Measure
Depending on the project, our devices will capture raw data on a range of sensing dimensions, such as light, air, soil, movement, and bioacoustics. The data is then processed and analyzed, then stored locally on the device and/or sent via the mobile network where available.
3
Visualize
The captured data is then made available in dashboards and reports, or through our API, depending on the project’s needs.
4
Understand
Finally, we can support you in analyzing the captured data to understand the underlying trends and anomalies.
Check out our case studies, and see what we can do together.
Read the case studyDeepen our collective understanding of ecosystems
Local and global

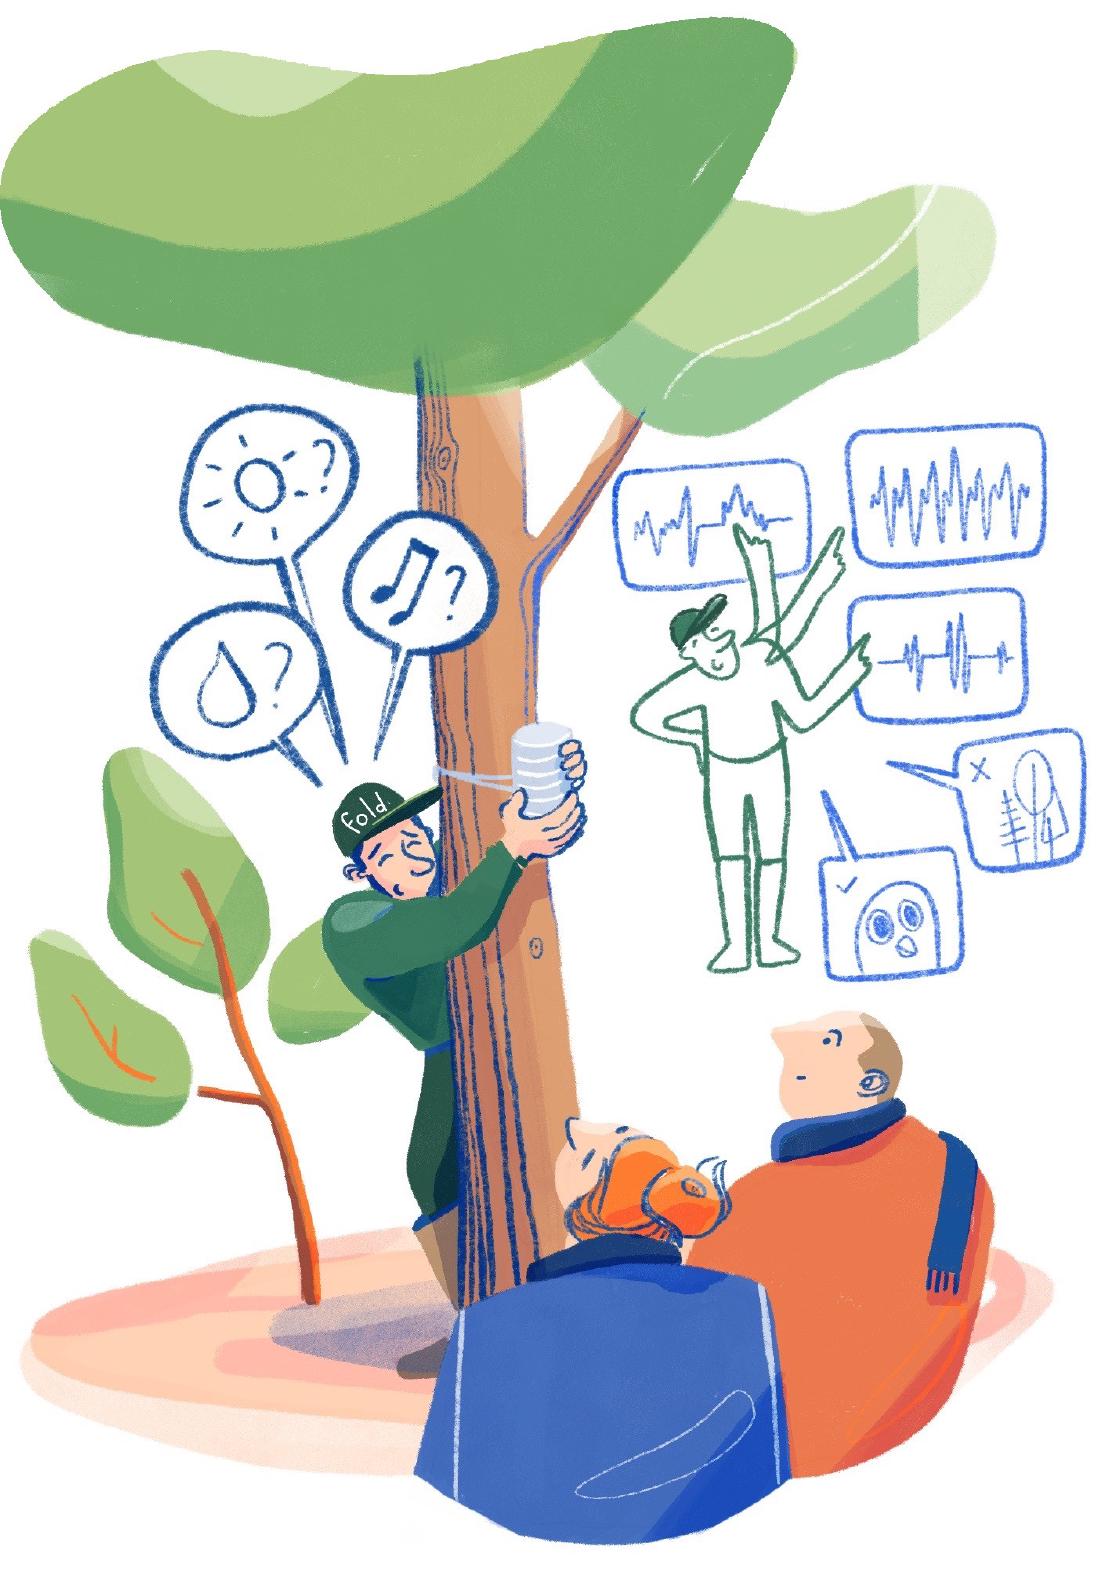
Local sensing
Our sensing devices listen to their local environment through a multitude of sensor modalities, and learn to recognize events of interest.
Global intelligence
We integrate data from all sensor nodes in all deployments, together with external sources, to learn what makes ecosystems tick.